Cost Per Megawatt Reduction Using Automated Solar Tube Lasers: An Electro-Optical and Pneumatic Optimization Analysis
The economics of utility-scale solar tracker manufacturing live or die on two numbers: watts per module and dollars per structural ton. When engineering teams evaluate cost per megawatt reduction using automated solar tube lasers, the conversation typically collapses into a single procurement metric — cycle time. That is a mistake. The real cost driver sits at the intersection of electro-optical conversion efficiency, chuck pneumatic stability, and assist-gas consumption. A 6 kW fiber source running at 38% wall-plug efficiency does not deliver the same $/MW as a 4 kW unit running at 45% with a tighter beam parameter product. This whitepaper dissects the physics and the floor-level parameters that determine whether a solar tube line trims $1,800/MW or $4,200/MW off a tracker torque tube assembly.
Electro-Optical Conversion: Where the Kilowatts Actually Go
Modern fiber laser resonators used in tube processing (IPG YLS series, Raycus RFL-C series, nLIGHT alta) convert electrical input to optical output at 35–45% efficiency depending on diode stack age and cooling loop delta-T. The remaining 55–65% becomes waste heat dumped into the chiller circuit. On a 6 kW resonator running two shifts (16 h/day, 6 days/week), that is roughly 4,100 kWh/month of thermal load the facility pays to reject. Multiply across a 12-station tube line and the parasitic chiller cost alone reaches 49,000 kWh/month.
High-wall-plug-efficiency resonators paired with variable-frequency chiller drives cut that parasitic load by 22–28%. The optical chain matters too: a 100 µm core delivery fiber with 0.22 NA loses roughly 1.8% per mated QBH connector. Three connectors in the beam path on a gantry-mounted cutting head means 5.4% optical loss before the collimator. Switching to a 50 µm core with matched optics recovers 3–4% of that, which translates directly into reduced duty cycle per part.
Duty Cycle and Frequency Selection for Thin-Wall Tube
Solar torque tubes are typically 2.0–3.5 mm wall in S355JR, SUS304, or Al6061-T6. Cutting 3.0 mm SUS304 at 1.2 MPa nitrogen requires roughly 4.2 kW average power at 100% duty. Running the same cut at 1,200 Hz pulse frequency with 65% duty cycle and 5.5 kW peak reduces dross adhesion and improves edge squareness to within 0.08 mm — critical for downstream weld fit-up on the bearing housing. The trade-off is thermal lensing in the focusing optics; a 200 mm focal length lens at 5.5 kW peak will shift focal position by 0.4 mm over a 4-hour shift unless active water cooling is applied to the lens holder.
High-Pressure Assist Gas: The Hidden $/MW Multiplier
Nitrogen delivery at 1.2–1.5 MPa nozzle pressure consumes 28–42 Nm³/h on a 3 mm stainless cut with a 1.4 mm nozzle orifice. At bulk liquid nitrogen pricing of $0.28/Nm³ (delivered, vaporized, and piped), that is $9.50–$11.80 per operating hour per cutting head. A four-head solar tube line running 16 h/day burns $608–$755 daily in N2 alone. Over a 300-day year, that is $182,000–$226,000 in assist gas — often exceeding the amortized capital cost of the laser itself.
Two mitigations dominate field practice. First, high-pressure air cutting (compressed to 2.0–2.5 MPa, dried to -40°C PDP) on Al6061-T6 and thin S355JR replaces nitrogen entirely for non-critical edges, cutting gas cost by 78–85%. Second, nozzle standoff optimization from 0.8 mm to 0.5 mm reduces gas consumption by 14% while maintaining kerf quality. Both require the cutting head to hold Z-axis tolerance within ±0.05 mm across a 6 m tube — which brings us to chuck dynamics.
Chuck Pneumatic Pressure and Tube Runout
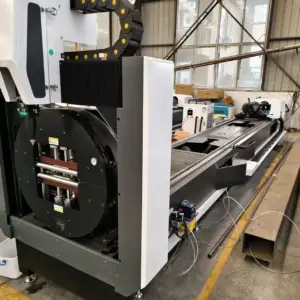
Pneumatic self-centering chucks on solar tube lasers typically clamp at 0.5–0.7 MPa. Below 0.45 MPa, tube slip during high-speed rotation (120 rpm on a 6 m S355JR tube) introduces runout exceeding 0.3 mm, which destroys focal consistency and forces the operator to slow feed rate by 20–30%. Above 0.8 MPa, thin-wall SUS304 (2.0 mm) deforms elliptically, and the downstream weld fixture rejects the part. The sweet spot for most tracker tube geometries sits at 0.55–0.62 MPa with a soft-jaw insert (polyurethane 90 Shore A) to distribute clamping force.
Comparative Technical Data: Legacy vs. Automated Laser
| Parameter | Plasma Cutting (Legacy) | Mechanical Sawing (Legacy) | Automated Fiber Tube Laser |
|---|---|---|---|
| Material (representative) | S355JR, 3.0 mm wall | S355JR, 3.0 mm wall | S355JR / SUS304, 3.0 mm wall |
| Cut edge tolerance | ±0.8 mm | ±0.5 mm (burr-dependent) | ±0.08 mm |
| Hole feature capability | Requires secondary drill | Not applicable | In-process, 0.15 mm positional |
| Energy per meter of cut | 0.42 kWh/m | 0.18 kWh/m (spindle only) | 0.09 kWh/m (optical + chiller) |
| Assist gas cost / hr / head | $4.10 (O2, 0.7 MPa) | $0 (coolant amortized) | $9.80 (N2) / $1.60 (HP air) |
| Post-process deburring | Required, 12 min/part | Required, 8 min/part | Eliminated on N2 cuts |
| Cycle time, 6 m tracker tube | 14.2 min | 9.6 min | 3.4 min (multi-feature) |
| Estimated $/MW contribution | $3,900 | $3,150 | $1,420 |
The $/MW figures assume a 2.5 MW tracker block requiring 340 m of processed tube. The laser column reflects nitrogen cutting on SUS304 and HP-air cutting on S355JR, blended at a 40/60 ratio. The delta against plasma is $2,480/MW; against sawing, $1,730/MW. Across a 400 MW annual build, that is $692,000–$992,000 in direct fabrication savings before accounting for labor reduction (one operator per four-head line versus three operators per plasma cell).
Automation Layer: Where the Real Compounding Happens
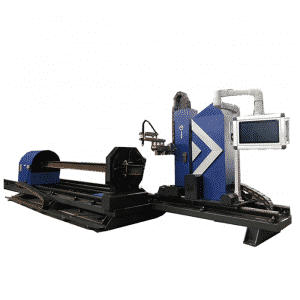
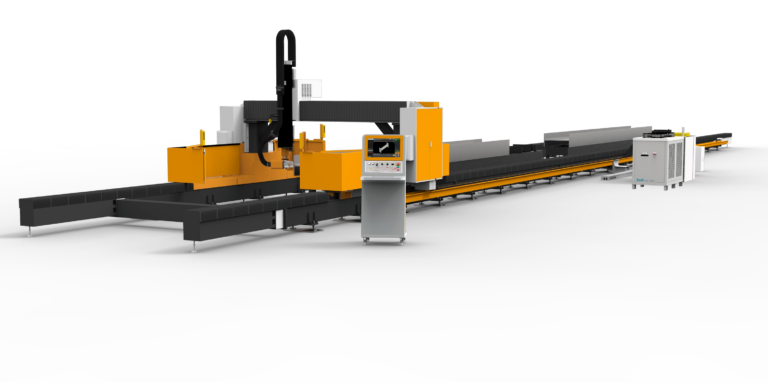
A four-head automated solar tube laser with automatic bundle loading, in-process tube rotation, and post-cut part sorting eliminates 78% of non-value-added handling time. The PLC handshake between the loader and the cutting head must hold cycle synchronization within 1.2 seconds; drift beyond that causes tube collision at the chuck and a 40-minute recovery. Field data from lines running Siemens 840D sl controllers show that encoder feedback on the chuck rotation axis (resolution 0.001°) combined with a laser-based tube-end detection sensor reduces scrap from 2.8% to 0.4% on first-article runs.
Power monitoring at the resonator DC bus is the most underused diagnostic. A 3% drift in wall-plug efficiency over 6 months signals diode degradation; catching it early and scheduling a diode module swap during a planned changeover avoids the 15% feed-rate penalty that creeps in when operators compensate manually.
Frequently Asked Procurement Questions
What is the realistic payback period for an automated solar tube laser line?
On a 400 MW annual tracker build with 340 m of tube per 2.5 MW block, a four-head automated line at $1.4M–$1.9M capital typically pays back in 14–22 months, driven primarily by assist-gas substitution (HP air for N2), elimination of deburring labor, and reduction of first-article scrap from 2.8% to under 0.5%.
Can a single laser source feed multiple cutting heads on a solar tube line?
Yes, via time-shared beam switching with a rotary optical switch. However, switching latency of 0.8–1.4 seconds per head change and 4–6% optical loss per switch make it economically viable only when tube cycle times exceed 90 seconds. For tracker tube work at 3.4 min/part, dedicated sources per head deliver better $/MW.
What chuck pneumatic pressure should be specified for 2.0 mm SUS304 solar tube?
Specify 0.55–0.62 MPa with polyurethane soft jaws at 90 Shore A. Below 0.45 MPa, rotational slip at 120 rpm introduces runout above 0.3 mm. Above 0.8 MPa, thin-wall ovality exceeds 0.25 mm and downstream weld fixtures reject the part.